
Mapping the Laramie Plains, Part II Third dimension captured at last
To refresh your memory, and for you who missed it last week, Part I of this story began with the promise of a map of the Laramie area on which "almost every hill and cañon (sic) can be determined at a glance!" according to the Laramie Boomerang in 1893. Yet the story ended before we could share in the excitement. That's because the back story was so long—three millennia!
It began in the 12th century B.C., when Egyptian scribe Amennakhte drew the earliest surviving map showing the shape of the land—a topographic map. It featured a winding line with large flat cones on either side—a valley between hills. Maps would be similarly crude for the next three thousand years, with hills and mountains drawn as simple pictures, and located only roughly at best.
Methods had improved by the 1800s, when the young United States was acquiring large chunks of unknown territory. Maps by William Clark (of Lewis and Clark) and Charles Preuss (John C. Frémont's cartographer) added significantly to our geological knowledge. But they weren't perfect. Clark put today's Colorado too far north, thereby eliminating the Laramie Plains and much of southern Wyoming. Preuss's map was accurate for major features, but finer details could be unreliable, as we saw on the Laramie Plains.
There was another problem. Mountains were represented with hachures—short parallel lines that suggested relief but provided little specific information. The third dimension remained elusive.
Mapping resumes after a grim hiatus
The Army Corps of Topographical Engineers continued to explore and map the American West through the 1850s. The emphasis was route-finding, exemplified by the Pacific Railroad Survey—four concurrent expeditions looking for a way across the Rocky Mountains. But with start of the Civil War, mapping stopped, except as needed by the Union Army.
Less than five years after the War's end, the government was again investing in maps. They were badly needed. While France and England were putting final touches on national maps, and a dozen more countries had surveys in progress, the United States lagged far behind.
But a young U.S. Army Lieutenant, George Montague Wheeler, had a plan. In 1870, he presented a detailed proposal to map the United States west of 100º longitude (which roughly bisects the Dakotas). In need of post-war work, the Army Corps of Topographic Engineers jumped at the opportunity. In 1871, Wheeler launched his "Survey West of the One-Hundredth Meridian."
Where on Earth are we?
A year later, on November 30, 1872, James H. Hayford of the Laramie Daily Sentinel reported that "Some parties are putting up some aparatus [sic] and a temporary observatory near our office today, under the supervision of Lieut. Wheeler, for the purpose of taking some astronomical observations to determine the latitude and longitude of this place," i.e., our position on the global grid.
Wheeler's men, John H. Clark and F.R. Simonton, had already made astronomical observations at two locations in Wyoming: Fort Fred Steele and Cheyenne, where they had come up with a handy improvement to standard procedure. "A large wall-tent drawn over a framework formed the observatory. ... it was found to be an improvement to retain the ridge-pole [during observations] as a support against the violent winds so prevalent."
Longitude by wire
As in Frémont's time, determining longitude was the big challenge. There was no way to measure it directly. Instead, it was calculated by measuring LOCAL TIME (relative to Greenwich Mean Time)—in this case, the difference in time of given celestial events in Laramie and in Salt Lake City, where exact longitude had been determined in 1869. To do so, they used the near-instantaneous communication of telegraphy.
Time was recorded by chronograph—a combination of chronometer (clock) and grapher (paper-covered cylinder). Powered by a small battery, the cylinder turned exactly once per minute, as a pen marked each chronometer tick every second. After each minute, the pen-holder advanced slightly. The result was a piece of paper covered in parallel lines of tick-marks, a printed record of time.
Clark and Simonton added their astronomical observations to the chronograph record, in real time. One man kept an eye on the heavens while also recording meteorological conditions and other notes on a paper form. When a star to be tracked approached, he notified the Observer at the telescope. At the moment the star entered the telescope's field of view, the Observer tapped a key wired to the chronograph, thereby leaving a mark on the paper. He did the same when the star passed out of view.
This was only half the project. Each time the Observer in Laramie pressed the key, the signal also was sent via telegraph to a chronograph in Salt Lake City, overseen by their coworker, E.P. Austin. From the paper records, they determined that stars passed over Laramie first by 25 minutes, 12 seconds, putting the Laramie observatory at approximately 105º 35' 24" longitude, only about four blocks too far east according to Google Earth—not bad for field data!
Star-gazing in Laramie in December
Obviously, Clark and Simonton were able to determine longitude much more accurately than Frémont did in the wilds of the Laramie Plains three decades earlier. But the work remained challenging. They had a rigid base, but thundering trains shook instruments out of adjustment, and the metal contracted and expanded with temperature. Ink froze on the coldest nights, and the men's concentration waxed and waned with weather and amount of sleep.
For accuracy, multiple stars were observed on multiple nights—but only when skies were clear at both ends of the telegraph line. To get enough observations, Clark and Simonton had to spend most of December in Laramie, "subjected to too much cold and too many wind and dust storms for any human brain and muscle to effect its best work in astronomy," according to Clark.
Mapping the Laramie Plains
Before a map of the Laramie Plains was produced, the Wheeler survey and three others were terminated, replaced with a single agency, the United States Geological Survey (USGS). Its mission was "classification of the public lands, and examination of the geological structure, mineral resources, and products of the national domain." In 1882, this was expanded to include a national map.
A decade later, on August 26, 1892, the Boomerang had great news. USGS surveyors Frank Tweedy and James McFarland had arrived and would "commence work upon the topography of this section of the country"—part of the national map of the United States already ten years underway. "This vast map will take at least 25 more years to complete [it would be more like a century] ... [and] when completed, would, if spread out, cover a little over 3/4 acre ..."
Obviously impractical, the great map had been divided into sheets, each named for a prominent local feature (for example, the Laramie sheet). Vertical relief would be shown with contour lines, now known to be far better than hachures, which cluttered maps, provided limited information, and were expensive to draw and print (almost as costly as the fieldwork!).
No need to bother with longitude
The point established by Clark and Simonton twenty years earlier did not go to waste. Tweedy and McFarland used it as the starting point their survey work. From it, they ran a baseline along the bed of the Union Pacific Railroad north of Laramie for 2.5 miles. The ties supported their tape nicely, and there was no brush to clear.
Their methods show how far accuracy had come. The tape was held at 20 lb. tension using a spring balance at one end. After every four lengths, they remeasured and calculated the average. The metal tape was precisely 300 ft long, but that was at 62ºF. They tried to work mostly on cloudy days or at night to minimize expansion and contraction. They also kept a record of air temperature, for later adjustment (0.02289456 inch per degree).
Using the baseline as a reference, Tweedy and McFarland established points across the Laramie Plains through triangulation—measuring angles. No longitude determinations needed! And no trees obscured their view. In this way, they determined distance, direction and height of prominent features—mountain summits, ends of ridges, forks of creeks, for example. At the same time, they made detailed sketches of the landscapes.
After several months of survey, Tweedy boarded a train and transported the data and sketches home to Washington DC. There he and others magically turned them into a map (we have to leave it at that, due to space limitations.)
Reading the lines
Six months later, in March 1893, W.O. Owen, County Surveyor, received preliminary sheets for review (he had mapped Albany County the decade before, using shading to show relief). According to the excited Boomerang reporter who saw them, "The contour lines are so explicit that almost every cañon and hill can be determined at a glance."
Well, maybe. For many people, contour maps were new and counterintuitive. So the USGS provided an explanation with each map to help users interpret the winding lines. "Each contour [line] passes through points which have the same altitude. One who follows a contour on the ground will go neither uphill nor downhill, but on a level ... a succession of these contour lines far apart on the map indicates a gentle slope; if close together, a steep slope; and if the contours run together in one line, as if each were vertically under the one above it, they indicate a cliff."
Even the depressions of the Laramie Basin were mapped using contour lines. In fact, they are textbook examples—literally! They appeared as Plate 170B in "The Interpretation of Topographic Maps" (USGS 1908). "In many parts of the country are depressions or hollows with no outlets. The contours, of course, surround these, just as they surround hills. The small hollows known as sinks are usually indicated by hachures, or short dashes, on the inside of the curve."
View Laramie topographic maps online
On the USGS topoView search page (https://ngmdb.usgs.gov/topoview/viewer/), enter "Laramie, WY" in the Search by Location box. At the top of the list is the first Laramie topographic map, published in 1895. Click the thumbnail for a high-resolution image.
By Holllis Marriott
Caption: This excerpt from the first "Laramie Sheet" (1895) nicely illustrates mapping with contour lines. Increasingly-close lines east of Laramie are foothills of the Laramie Range. To the south, Red Buttes have very dense lines on their steep sides, and none on the flat tops. West of town, gentle terrain with lines far apart stretches for miles before running up against the steep east side of Sheep Mountain.
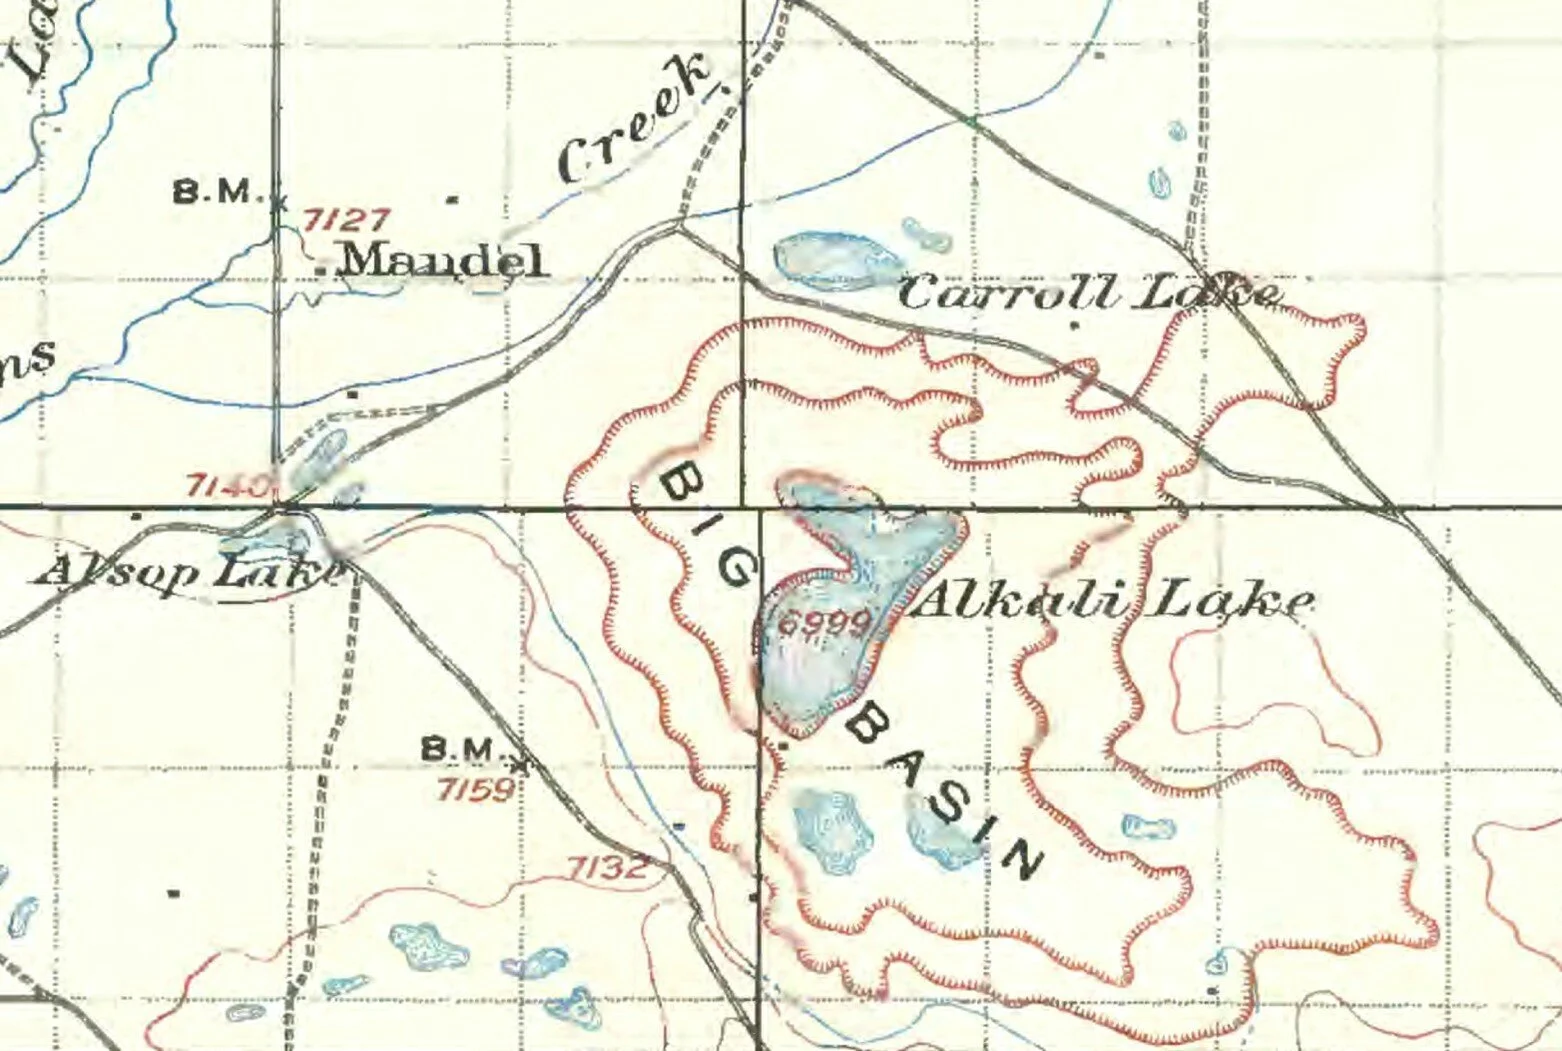
Caption: Excerpt from "Plate 170B: Special types of lakes: part of Laramie (Wyo.) sheet," showing the textbook (exemplary) hollows or sinks of the Laramie Plains. "Big Basin" is the Bamforth Lakes area. Each square is one square mile. (1908 USGS publication).